Attribution Methodologies for the Modern Marketer
Learn about a more accurate way to measure attribution for your streaming TV campaigns
Oftentimes marketers have to rely on legacy attribution models for their TV measurement. Take view-through attribution, for example - it was initially built for digital advertising but is used to measure TV advertising too. Being in the TV space, we believe that TV should be measured with tools built for the channel. Rather than rely on metrics that were built for digital, Tatari developed a view-through attribution metric designed, and optimized, solely for TV using TV-specific device graph data and proprietary methodologies.
At Tatari, we offer two view-through attribution methodologies: digital view-through and Tatari view-through, as well as incremental. Read on to learn more about the different ways to measure TV ad campaigns and how your brand could benefit from each type.
Is Digital View-Through Truly the Best Metric for your Brand?
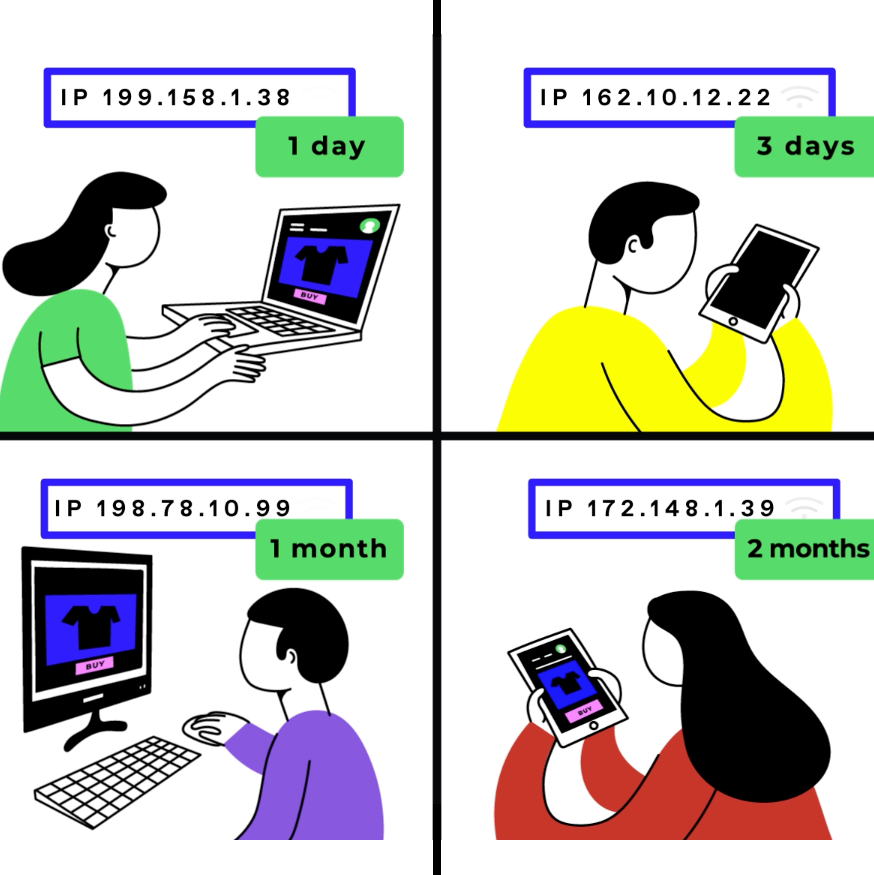
For TV measurement, typical view-through is constructed similarly to the digital marketing industry - the IP address of an impression is matched to the IP address of the response over a specified time period. This is useful when you want to do an apples-to-apples comparison of TV performance to your digital campaigns, but it also comes with some challenges.
When using this methodology, your streaming TV campaign receives credit if the responding IP delivered an impression, regardless of whether the user was influenced by ads on other digital channels, which can very easily lead to an over-attribution of view-through.
Why Tatari View-Through is a Better Metric for TV Ad Campaigns
Tatari view-through attribution is a TV attribution methodology built on TV-specific device graph data and methodologies. While it’s conservative in nature, it’s more accurate than industry-applied digital view-through. We established Tatari View-Through as a way to combat the previously mentioned over-attribution that can occur with Digital view-through and as a way to provide a measurement solution built solely for TV.
Client Case Study
We decided to put our measurement solutions to the test with a client case study. We found that a small cohort of 8% of impressions served across mobile IPs actually accounted for an overwhelming 71% of digital view-through responses, indicating potential misattribution.
The issue stems from the internet service provider (or ISP) of the impression. There are two types of ISPs:
Home ISP: When your device is connected to wifi. Examples include Comcast, Spectrum, Verizon Fios, etc.
Mobile ISP: When your device isn't connected to wifi and instead uses your cellular service. Examples include AT&T Wireless, Verizon Wireless, etc.
In the graphic below, you can see mobile ISPs are actually the root cause of the issue. In this case, 6% of mobile impressions were served on a mobile ISP, however, these impressions accounted for 85% of digital view-through responses.
The issue with mobile ISPs comes from the fact that there are oftentimes shared IP addresses for mobile devices on the same cellular network.
The Tatari view-through methodology, while conservative in nature, corrects for mobile ISP impressions leading to a more accurate attribution than industry-applied digital view-through.
As you can see in this visual, the Tatari view-through methodology results in the 6% of mobile ISP impressions having a much more realistic lift of the total response.
Which Tatari Attribution Metric is Best for Your Brand?
In addition to Tatari View-through and Digital View-through, Tatari also offers Incremental attribution. Our incremental method only gives credit to those who responded to your streaming TV ad, and not from other marketing sources. Each attribution methodology serves its own purpose. In general, we recommend using:
Incrementality to measure the true efficacy of your streaming TV campaigns.
Tatari view-through when you have a high baseline of traffic or if your product or service has a long consideration period (e.g. healthcare, insurance, car rental, etc.)
Digital view-through when you want to run multi-touch attribution analysis or complete a comparison of TV performance to your digital campaigns.
Incremental, Tatari view-through, and Digital view-through are available in the Tatari platform. This is a high-level overview, please reach out to our Client Services team to discuss which metrics are best for your brand.
Related
There Will Be No Kingmaking in the New World of TV Measurement
After decades of a “business as usual” approach to TV measurement, the industry has at last broken free of outdated paradigms and Nielsen’s quasi-monopoly on TV measurement.
Read more
Tatari Reveals the Secrets to Make UID 2.0 Work for Advertisers
This is the industry’s first UID 2.0 campaign for CTV and there’s a lot to break down and understand from this effort. Read more for a deeper dive into our process.
Read more
Video: DragFactor Helps Advertisers Measure Response from TV Ads
We know that marketers need to see their campaign’s performance results that measure both the immediate and delayed response. Watch our short video to learn more about DragFactor enabling next-day measurement.
Read more


